PSE Ticker

Monday, April 26, 2010

Best PE numbers for YE2009

PE ratio is the Price per Earnings Ratio obtained by dividing the Current price of stock by the earnings per share (total revenue less the overhead divided by the number of shares).

The smaller the number of the PE ratio, the better. This means for every peso you invest, you get a higher earnings,thus the faster you can recover your capital. If a stock has a PE ratio of 5,this tells you that you can recover your capital from the earnings in 5 years. PE ratio of 50 means 50years.

For Value investors this number is very important. For me this tells much on the valuation of a stock based on the revenues.

Here is the table for your reference:

SCC

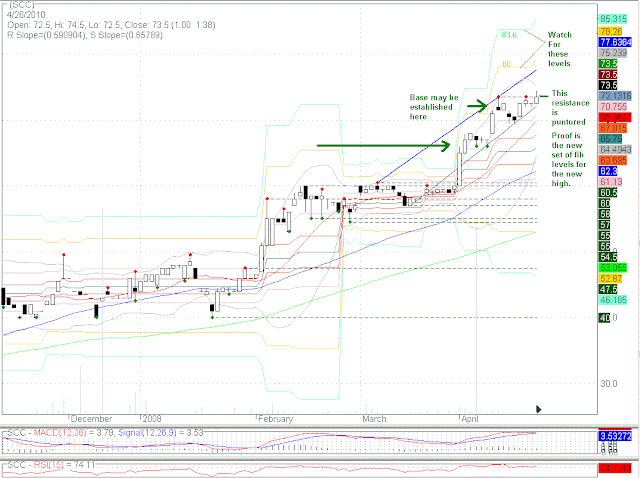
No doubt SCC has been one of the steady climbers lately. It has the characteristic of hovering just above 78.6%(pink) retracement after hitting the 127%(yellow)-162%(light blue) extension of the previous wave. Lately it has been doing so but today's low hit some kind of support line(gray) ending at a higher level for the day.This looks like a push towards the next level to me. Let's see what it does in the days to come.

Saturday, April 24, 2010

My Fibonacci Study

After some observation with the Philippine stocks, I find Fibonacci levels very interesting since these retracements really happen in real life. This is the reason why I've done some research on the subject.

First, let me present an excel table to show how the golden mean 1.618 can be observed in large values in the fibonacci series. By the way Fibonacci Numbers is a series wherein the next number can be obtained by adding the previous successive numbers hence 1 1 2 3 5 8 13 . . . 5 is obtained by adding 2 and 3. 8 from 3 and 5, 13 from 5 and 8. Here is the table:


In fibonacci application to technical analysis, there are levels called retracements that are observed to be respected by the collective decisions of buyers and sellers in the market. These are 61.8%(0.618), 50% (0.5), 38.2%(0.382), 23.6%(0.236).There are also extensions like 161.8%(1.618), 261.8%(2.618)and 127.2%(1.272)

Notice that in a system composed of many elements all the retracements are very evident.

There are very important applications for fibonacci in nature and architecture. Shell formations, branching in plants, flowers, petals, bee hive. Even the great pyramids are applications of fibonacci numbers.

What I observed is the alignment of previous levels and the current levels and the applications are mostly in groups or crowds.

The very nature of price action whether it is in market for consumer goods, forex or the stock market is a result of collective behaviour of buyers and sellers. This, I believe is the very reason why fibonacci levels are respected in the stock market.

Below is an example Philippine stock that really shows respect on the fibonacci levels. This is the recent chart of AEV:


Right now I believe AEV is ready to move up again and based on the fibonacci bands the level it could hit before consolidation could be 18.2. However this is not 100% sure. No stock ever rises eternally. That uncertainty is the risk the reader must take when buying this stock.

Wednesday, April 21, 2010

April 21, 2010: Some noticeable charts.

PNB: Philippine National Bennant (Pennant).
Maybe... let's just wait and see..


OREo cookie?


I view ORE's chart bullish based on retracement and a possible handle in the making.

FLI: April 21, 2010


FLI looks good! It bounced off 50% of the immediate wave and the 127% extension of a previous wave. Also it bounced off some kind of channel that points upwards. MACD and RSI are in reversal mode.

I expect 1.1 level to be reached but let's just see what the chart reveals.
Note: All the bands and lines (except fot the personal comments) are automatically generated. These are the bollinger, Moving averages and the fibonacci bands. The chart looks messy. Hence, wild!!

Monday, April 19, 2010

PSEI Analysis, April 19, 2010


PSEI looks bad today. If there is no intervention against the Goldman Sachs Fraud case, the index may return to 3000 before bouncing up.

As can be seen in the chart, 38.6% re-tracement is already breached. MACD is weakening and RSI just bounced off 70. These all points to breaching 50% retracement or, worse yet,the 61.8% retracement. This means the index may go down or sideways.

This is why I'm staying on the sidelines for now and left no stocks except for preferred shares which I bought for dividends. Such stock's price does not matter as long as the dividends pour in regularly.